Multi-Language Market Simulation Platform Setup Notes: Overseas Demo Trading with Time-Based Chart Visualization
Multi-Language Market Simulation Platform Setup Notes: Overseas Demo Trading with Time-Based Chart Visualization
Disclaimer: This article is for technical education and demonstration only. It is not investment advice, nor an invitation to operate real financial products. Real financial operation requires appropriate licenses and compliance with local laws. No returns or profits are guaranteed.
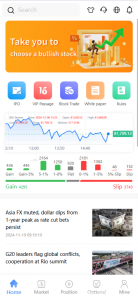
Earlier this year I took on a customization project for a market simulation platform. The client wanted a rebuilt frontend UI, a new savings-wallet demo module, and English plus Thai language packs on top of the original build. The system itself runs overseas demo trading with a time-based chart format, a common pattern in paper-trading education. After delivery, I organized the whole process into these notes so others can avoid the detours I took.
1. Gameplay and Functional Structure
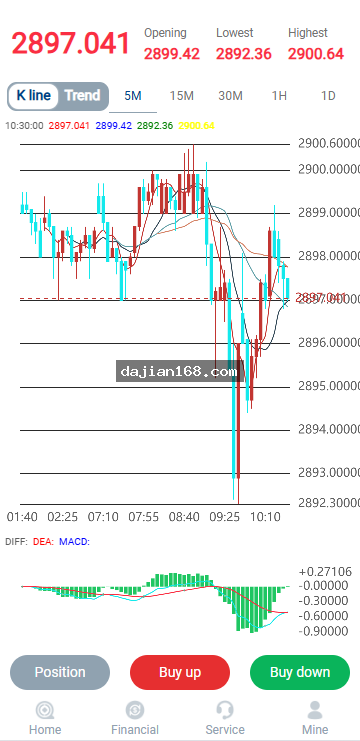
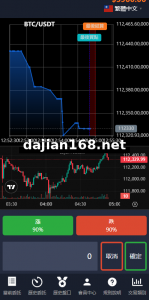
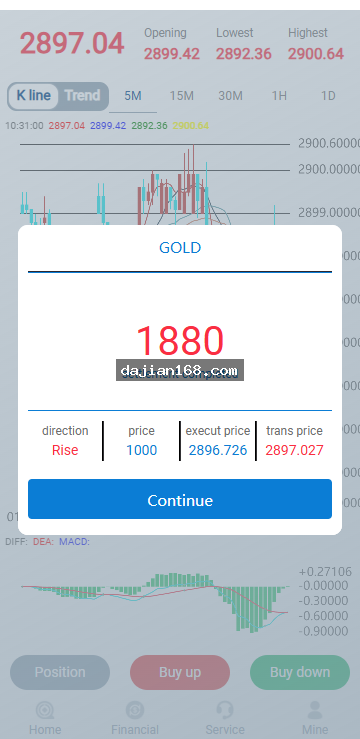
The core of a market simulation platform is the time-based chart format: a user picks a demo asset, allocates practice funds, predicts the price direction, and waits for a fixed period (30s, 60s, 180s, etc.) to visualize the outcome. A matching prediction credits the practice balance; a mismatch debits the allocated amount. The time-based chart mode runs this logic on second-level cycles. The main features of this customized version:
- Demo Trading Time Rounds: Multiple demo products (forex pairs, commodity-style indices), multiple period tiers, with demo multipliers configurable per period
- Time-Based Chart Mode: 30-second and 60-second rapid visualization, frontend countdown animation, results pushed in real time
- Savings-Wallet Demo Module: Newly added in this customization; users transfer demo balance into a savings wallet to accrue daily practice points with flexible deposits and withdrawals
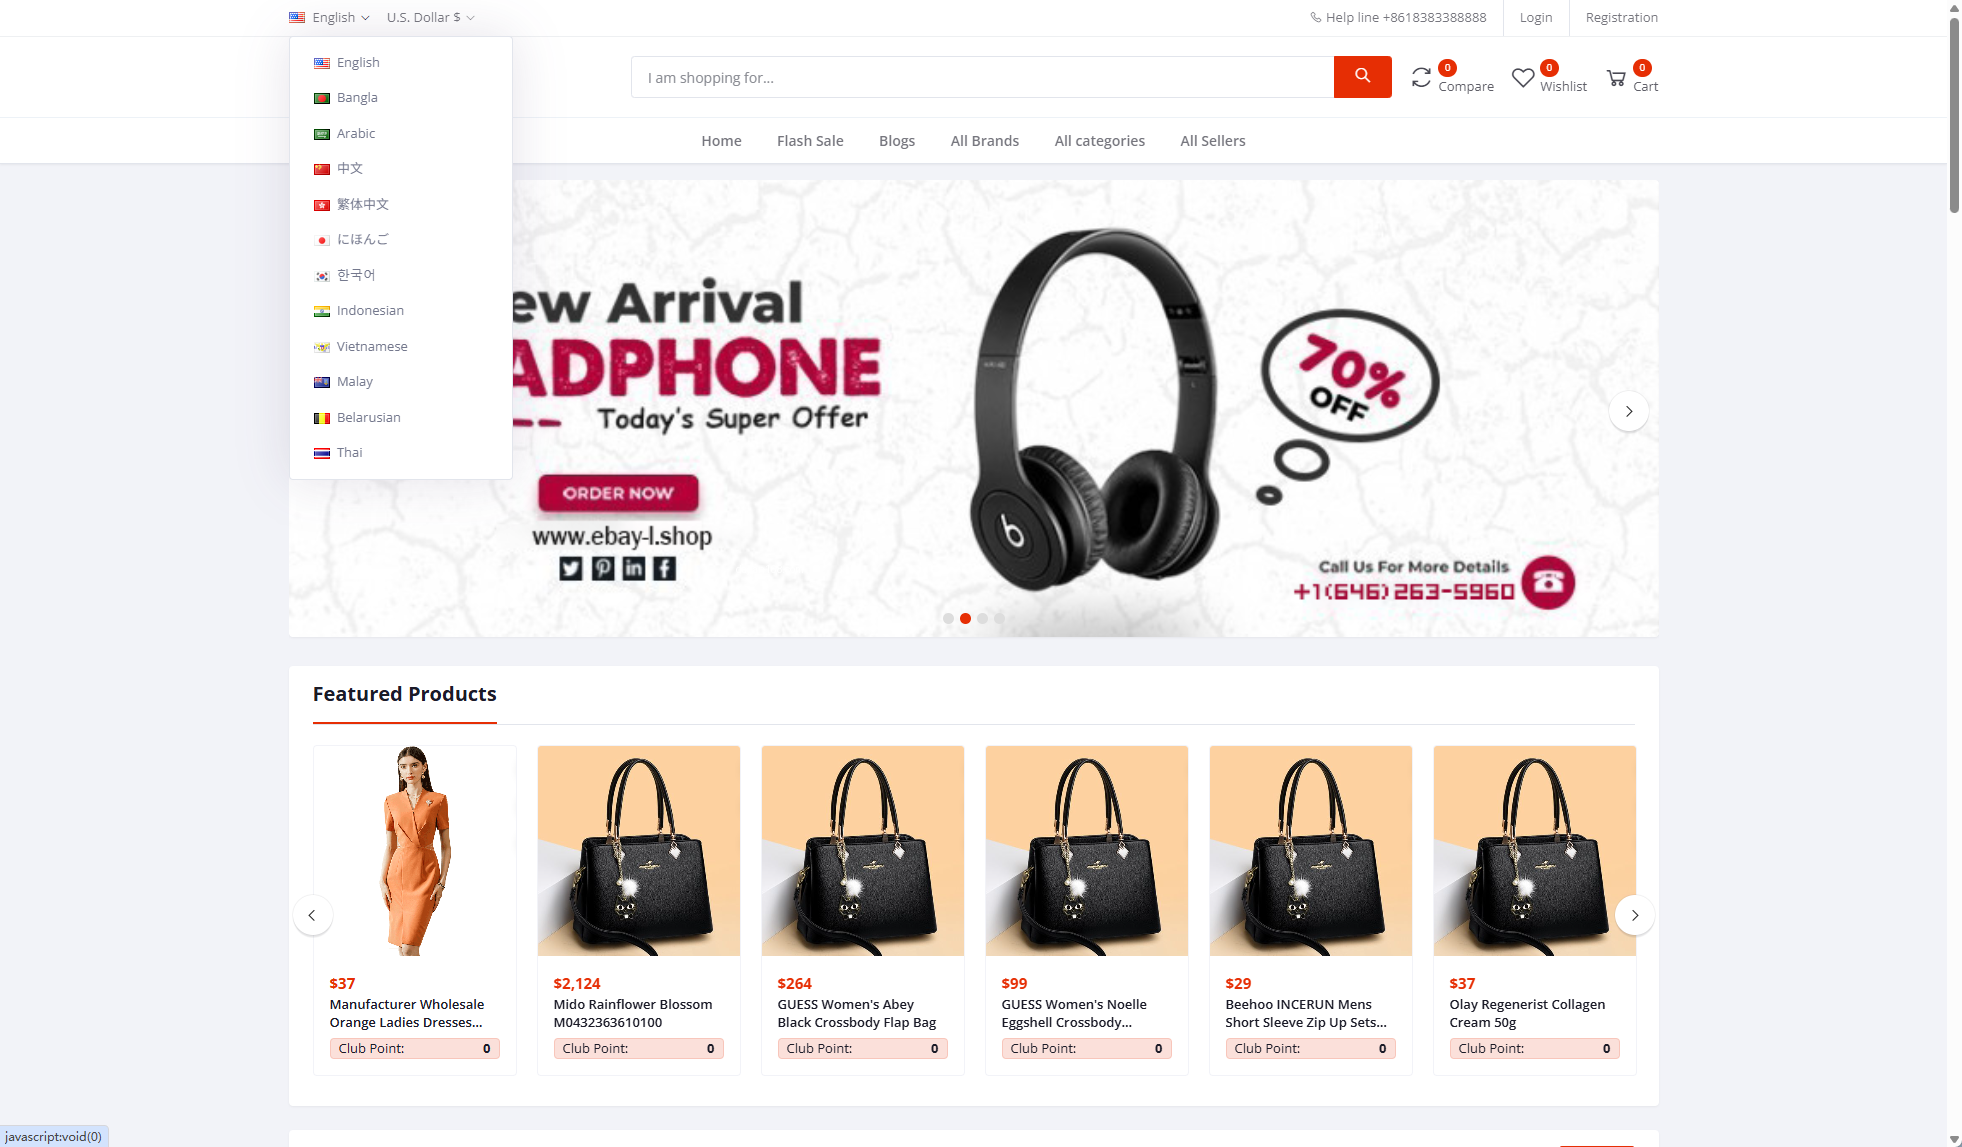
- Multi-Language: New English and Thai language packs, with instant frontend switching
- Market Data Integration: Real-time market quotes with frontend K-line rendering
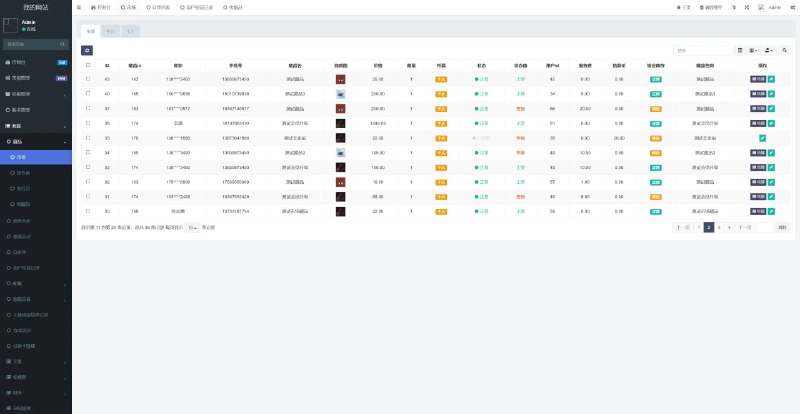
- Referral Dashboard: Partner panel shows downline demo activity, with reward ratios adjustable in the backend
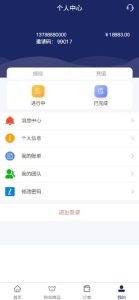
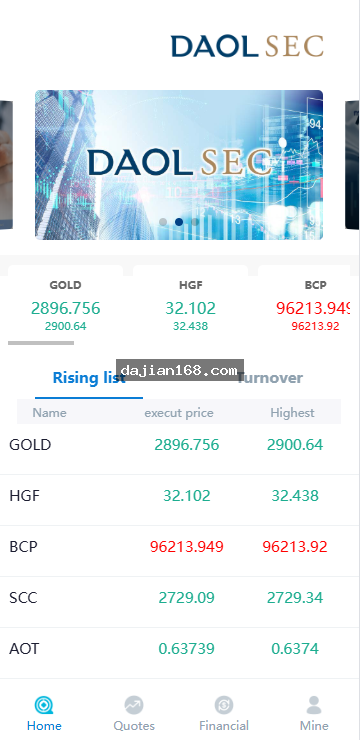
The frontend UI was completely rebuilt this time, much cleaner than the old version, with optimized mobile adaptation. Around 90 percent of market simulation users come from mobile, so the mobile experience directly determines retention.
2. Deployment Environment and Key Configurations

Before deploying this system, several items must be ready in advance. I lost half a day over a certificate issue:
- Server: 2 cores 4GB minimum; 4 cores 8GB recommended when time-based chart concurrency is high
- PHP environment exactly as the source code requires, with every extension installed
- MySQL database; verify table structure completeness after importing the initial SQL
- Redis is mandatory: market caching, simulation queues, and savings-wallet accrual tasks all depend on it
- SSL certificate: WebSocket runs over wss, and without a certificate the frontend cannot connect to quote pushes
- Crontab entries: simulation tasks, daily savings-wallet point distribution, and statistics jobs all run on schedules
The most critical configuration items are the market data feed and simulation parameters. If the quote source goes down, the entire demo platform halts, so configure a backup data source. Simulation multipliers, period tiers, and minimum allocations are all under demo configuration in the admin panel; test every period with small amounts before going live.
3. Pitfalls During Customization
3.1 Inaccurate Savings-Wallet Accrual
Right after launch, testers reported mismatched accrual. The cause: the accrual job ran once daily via crontab, but mid-day deposits and withdrawals were calculated as full-day balances. I switched to hourly balance snapshots, settling daily accrual on the minimum balance, and the numbers finally reconciled. Always add logging to accrual jobs for auditing.
3.2 Time-Based Chart Visualization Delay
During peak hours, testers complained about slow result visualization. The simulation queue processed orders one by one. After switching to batch prefetching of expiring orders plus Redis pipeline writes, latency dropped from 3 seconds to under 200 milliseconds. Also, the visualization price should average multiple quote points; a single-point price invites manipulation complaints.
3.3 Language Switching Residue
After adding English and Thai, some testers saw half-translated pages. The problem was that the old version hardcoded some copy directly into frontend templates, bypassing the language packs. I went through the templates one by one and moved all hardcoded strings into language packs. When adding a new language, remember to translate admin announcements and email templates as well.
4. Risk-Control Demo and Operations Suggestions
The biggest risk for market simulation platforms is abuse rings and fraudulent accounts. Recommended configurations for this system: per-IP registration limits, device fingerprint binding, first-deposit review for new users, and manual withdrawal verification. Do not set the savings-wallet demo rate too high; I have seen a 0.3 percent daily rate drain the demo fund pool within a week. The same logic applies to referral rewards: start low and adjust gradually.
Important Notice: Market simulation and time-based chart products are for educational demonstration only. They do not represent real financial instruments and may be regulated in your country or region. Confirm the legal requirements of your target market before deploying any publicly accessible demo. Technology is just a tool; compliance is the lifeline. This article is for technical discussion only and does not constitute operational or investment advice.
5. FAQ
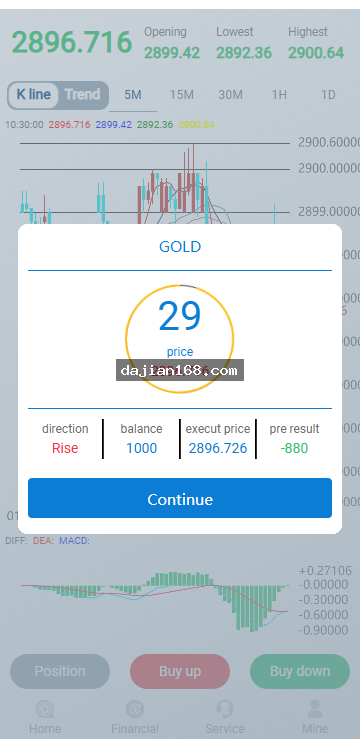
Q1: How is the visualization price for time-based charts determined?
The system uses the real-time price from the connected market feed at the end of each period. During customization, I recommend averaging the last 3 to 5 quote points of the period to prevent single-point anomalies from causing tester disputes and to avoid manipulation accusations.
Q2: When is savings-wallet demo accrual settled each day?
By default, a crontab job distributes accrual uniformly around midnight. After customization I switched to hourly snapshot-based accrual, so deposits and withdrawals at any time are calculated precisely. The rate is set as a daily percentage in the admin panel; 0.05 to 0.1 percent is a sane range for demonstration.
Q3: Can more languages be added beyond English and Thai?
Yes. Duplicate an existing language pack JSON, translate the entries, upload it, and enable it in the language management section. The frontend has several hundred terms; the bulk of the work is admin announcements and email templates.
Q4: What happens if the market data feed goes down?
Configure dual quote sources with automatic failover. During switchover, serve the most recent cached quotes from Redis. The admin panel should also alert staff; any feed interruption longer than one minute needs manual intervention.
Q5: Does the system support adding new demo modes?
The source code is cleanly structured, with the simulation core and visualization logic isolated as independent modules. Adding new modes mainly means extending the visualization module and building the corresponding frontend pages, which is a moderate workload.
Q6: Can this demo platform be used for real financial transactions?
No. This system is built for technical demonstration and risk-control education only. Real financial operation requires licensed platforms, legal compliance, and professional risk management. No returns or profits are guaranteed.
Source Reference
This content is based on the demo system at yanshigw.top/17728.html, reorganized and rewritten for reference purposes.
Disclaimer: For technical education and demonstration only. Not investment advice. Real financial operation requires appropriate licenses and compliance with local laws. No returns or profits are guaranteed.
#MarketSimulationDemo #TimeBasedChart #MultiLanguageDemoPlatform #DemoTradingPlatform #SavingsWalletDemo