Digital Asset Dashboard Demo Setup Tutorial: Market Simulation and Paper Trading Guide
Digital Asset Dashboard Demo Setup Tutorial: Market Simulation and Paper Trading Guide
Disclaimer: This tutorial is for technical education and demonstration only. It is not investment advice, nor a recommendation to perform real financial operations. Real-world financial platforms require appropriate licenses, compliance, and regulatory approval. The dashboard described here simulates market data and uses paper trading to help learners understand how frontend and backend components work together.
This guide walks through building a digital asset dashboard demo that visualizes market data, supports multi-language interfaces, and provides an admin panel for technical learning. The demo uses simulated market data, paper trading, and data visualization components such as K-line charts. It does not handle real funds, real leverage, or real financial returns.
Overview of the Demo Dashboard
The demo dashboard is a full-stack learning project built with:
- Frontend: responsive web interface with market data visualization (K-line charts, candlestick charts, and data tables).
- Backend: PHP-based services using Laravel-style command scheduling, WebSocket push, and queue workers.
- Database: MySQL for persistent configuration and metadata, Redis for caching and real-time data streams.
- Search & analytics: Elasticsearch for indexing and querying market data during simulation.
- Multi-language support: language files and localized UI labels.
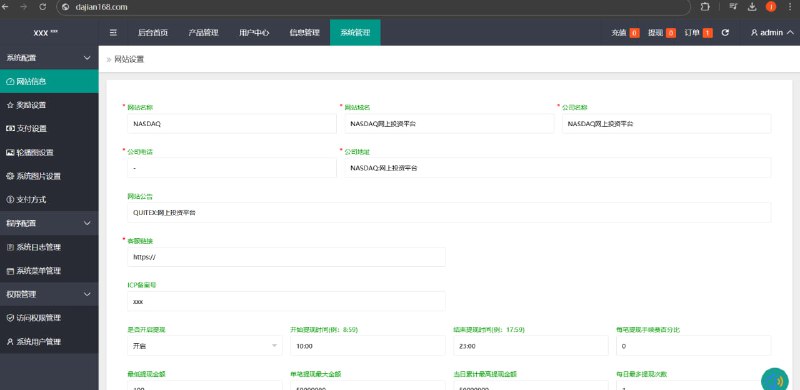
- Admin dashboard: management panel for viewing simulated market status, scheduled tasks, and system health.
All market activity inside the dashboard is simulated. Users can practice paper trading with virtual balances to understand how the interface behaves without any financial risk.
Prerequisites
Java Installation
Elasticsearch requires Java. This demo uses OpenJDK 1.8.
To check the installed version, run:
java -versionIf Java is not configured, add the environment variables to /etc/profile:
JAVA_HOME=/usr/lib/jvm/jre-1.8.0-openjdk.x86_64
PATH=$PATH:$JAVA_HOME/bin
CLASSPATH=.:$JAVA_HOME/lib/dt.jar:$JAVA_HOME/lib/tools.jar
export JAVA_HOME CLASSPATH PATH
Apply the changes:
. /etc/profileElasticsearch Installation
Download Elasticsearch 6.6.0:
wget https://artifacts.elastic.co/downloads/elasticsearch/elasticsearch-6.6.0.tar.gz
tar -zxvf elasticsearch-6.6.0.tar.gz
mv elasticsearch-6.6.0 elasticsearch
mv elasticsearch /usr/local
Edit /usr/local/elasticsearch/config/elasticsearch.yml:
cluster.name: my-es
node.name: node-1
path.data: /usr/local/elasticsearch/data
path.logs: /usr/local/elasticsearch/logs
network.host: 0.0.0.0
http.port: 9200
discovery.zen.ping.unicast.hosts: ["127.0.0.1", "10.10.10.34:9200"]
Create a dedicated user and assign directory permissions:
useradd es
passwd es
mkdir -p /usr/local/elasticsearch/data
chown -R es:es /usr/local/elasticsearch
Update system limits in /etc/security/limits.conf:
* soft nofile 65536
* hard nofile 131072
Update kernel settings in /etc/sysctl.conf:
vm.max_map_count=655360Apply the kernel settings:
sysctl -pStart Elasticsearch as the es user:
cd /usr/local/elasticsearch/bin
su es
sh elasticsearch -d
Verify that ports 9200 and 9300 are accessible.
PHP Extensions
Install the following PHP extensions for the demo backend:
- fileinfo
- opcache
- memcache
- redis
- imagemagick
- imap
- exif
- intl
- xsl
Disable any dangerous function restrictions that would block console commands.
Web Server and Ports
Open the ports required for the demo environment:
- 9200 (Elasticsearch HTTP)
- 3306 (MySQL)
- 888 (panel management)
- 443 (HTTPS)
- 39000-40000 (WebSocket / push services)
- 20, 21, 22 (standard server access)
Configure pseudo-static rules for the web server:
location / {
    try_files $uri $uri/ /index.php$is_args$query_string;
}
Market Data Visualization
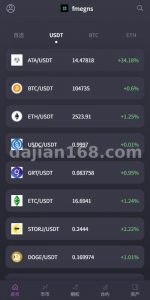
The dashboard displays simulated market data using K-line charts. These charts are generated from historical data stored in MySQL and cached in Redis for fast rendering.
WebSocket push is handled by the bundled message sender component. Start it with:
cd /www/wwwroot/demo_dashboard/public/vendor/webmsgsender
php start.php start
For production-like demo deployment, run it in daemon mode:
php start.php start -dScheduled Market Simulation Tasks
The demo uses scheduled commands to generate and refresh simulated market data. Adjust timing according to your learning environment. Below are example tasks configured on a Baota panel:
- Refresh 5-minute simulation data
cd /www/wwwroot/demo_dashboard php artisan get_kline_data_fivemin - Refresh 15-minute simulation data
cd /www/wwwroot/demo_dashboard php artisan get_kline_data_fifteenmin - Refresh 30-minute simulation data
cd /www/wwwroot/demo_dashboard php artisan get_kline_data_thirtymin - Refresh hourly simulation data
cd /www/wwwroot/demo_dashboard php artisan get_kline_data_hourly - Refresh daily simulation data
cd /www/wwwroot/demo_dashboard php artisan get_kline_data_daily - Refresh weekly simulation data
cd /www/wwwroot/demo_dashboard php artisan get_kline_data_weekly - Refresh monthly simulation data
cd /www/wwwroot/demo_dashboard php artisan get_kline_data_monthly - Start auto-simulation worker
cd /www/wwwroot/demo_dashboard php artisan auto_change start - Process background queue
cd /www/wwwroot/demo_dashboard php artisan queue:work - Run WebSocket scheduler
cd /www/wwwroot/demo_dashboard php artisan schedule:run websocket-client - Restart WebSocket client
cd /www/wwwroot/demo_dashboard php artisan websocket:client restart - Start WebSocket message sender
cd /www/wwwroot/demo_dashboard/public/vendor/webmsgsender php start.php start - Renew SSL certificate
/www/server/panel/pyenv/bin/python -u /www/server/panel/class/acme_v2.py --renew=1
Admin Dashboard and Multi-Language Support
The admin dashboard lets administrators inspect the simulated market status, monitor scheduled tasks, and review system logs. It is intended for learning how backend administration interfaces operate.
Multi-language support is implemented through language files and localized templates. The frontend switches between languages without affecting backend data processing, which makes it useful for understanding internationalization patterns in web applications.
System Architecture Summary
- Frontend: HTML/CSS/JS interface, K-line charts, multi-language selector, admin panels.
- Backend: PHP services with Laravel-style Artisan commands, queue workers, and WebSocket clients.
- Cache & real-time layer: Redis for session caching, market data snapshots, and pub/sub channels.
- Persistence layer: MySQL for user metadata, simulated market history, and configuration.
- Search layer: Elasticsearch for indexing and querying simulation data.
- Process management: PM2 or Baota panel task scheduler for background workers.
Conclusion
This demo setup provides a safe technical environment for learning how a digital asset dashboard combines frontend visualization, backend services, real-time data, and an admin panel. It uses simulated market data and paper trading only.
Reminder: This content is for educational purposes only. It does not provide financial, investment, or legal advice. Operating a real financial platform requires proper licenses, regulatory compliance, and professional oversight. Always follow local laws and regulations before building or launching any real financial system.